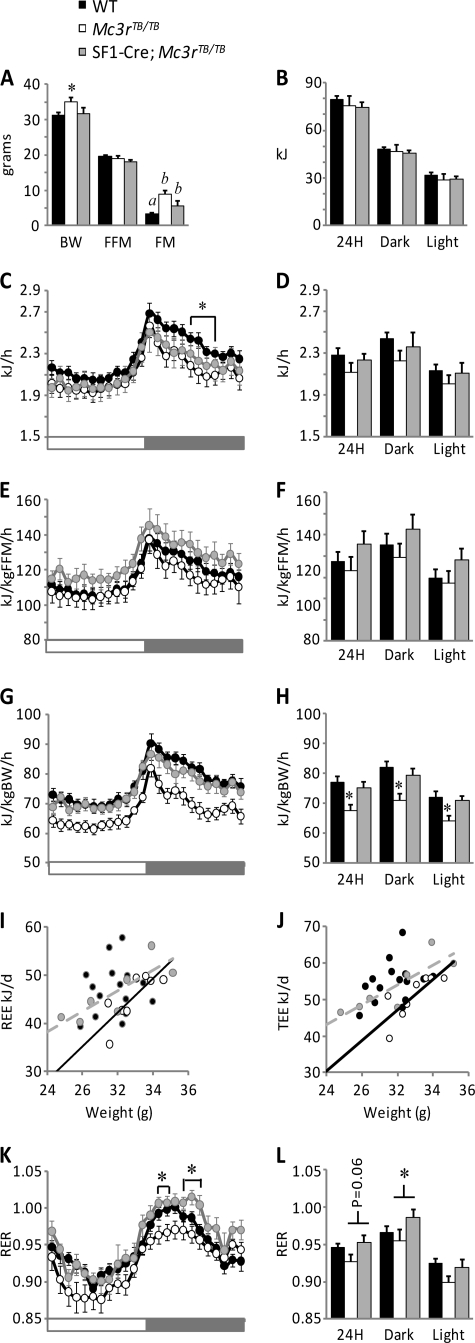
FIGURE 4.
Impact of altered Mc3r expression on whole body metabolic activity. A, body weight and composition of the WT (n = 16), Mc3rTB/TB (n = 8), and SF1-Cre;Mc3rTB/TB mice were used to assess whole body energy metabolism using indirect calorimetry. The difference in body weight of Mc3rTB/TB mice and WT was significant (*, p < 0.05). There was no statistically significant difference in FFM in the smaller cohort of mice used in these experiments. FM was significantly increased in Mc3rTB/TB mice; this was attenuated in SF1-Cre;Mc3rTB/TB mice. Values not sharing letters are significantly different, p < 0.05. The difference in fat mass of Mc3rTB/TB and SF1-Cre;Mc3rTB/TB mice did not achieve significance (p = 0.074). B, food intake was not affected by genotype (these data represent the average of 3 days of measurements). C and D, energy expenditure expressed as kJ/h. C, analysis of data expressed in 1-h bins indicated significantly lower energy expenditure of Mc3rTB/TB mice when compared with WT during a short period in the dark (*, p < 0.05). D, averaged energy expenditure over 24 h, in the dark or lights-on periods. E and F, energy expenditure normalized to fat-free mass (kJ/kgFFM/h). G and H, energy expenditure normalized to total body weight (kJ/kgFFM/h) was significantly lower in Mc3rTB/TB mice when compared with both WT and SF1-Cre;Mc3rTB/TB mice (*, p < 0.01). I and J, regression analysis of resting energy expenditure (REE) (I) or total 24-h energy expenditure (TEE) (J) as a function of body weight. K and L, the RER (an indicator of the ratio of energy derived from oxidizing glucose or fatty acids) is significantly higher in SF1-Cre;Mc3rTB/TB mice relative to Mc3rTB/TB mice.

