FIGURE 6.
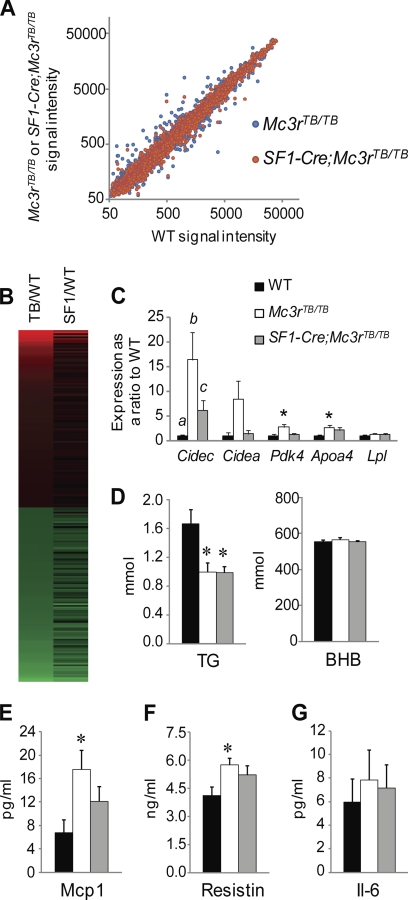
Microarray analysis of liver gene expression indicates that relaxed control of metabolic homeostasis in Mc3rTB/TB mice is improved in SF1-Cre;Mc3rTB/TB mice. A, scatter plot comparing the densities of gene expression in livers of Mc3rTB/TB or SF1-Cre;Mc3rTB/TB mice with WT. SF1-Cre;Mc3rTB/TB mice (red circles) exhibit reduced variability in gene expression relative to WT when compared with Mc3rTB/TB mice (blue circles). B, heat map comparing genes that exhibited >1.5-fold change in expression in Mc3rTB/TB (TB/WT) with SF1-Cre;Mc3rTB/TB (SF1/TB) mice. Red indicates up-regulation; green indicates down-regulation. C, assessment of genes selected from the microarray results by quantitative RT-PCR confirmed the effect of genotype on genes exhibiting large -fold changes in expression (Cidec, Cidea, Pdk4, and Apoa4). For Cidec, the presence of different letters indicates significance at the p < 0.05 level; for other genes, * indicates significance when compared with WT values at the p < 0.05 level. D, serum triglycerides (TG) and β-hydroxybutyrate (BHB). *, p < 0.05 when compared with WT. E–G, measurements of inflammatory cytokines in serum. *, p < 0.05 when compared with WT.

