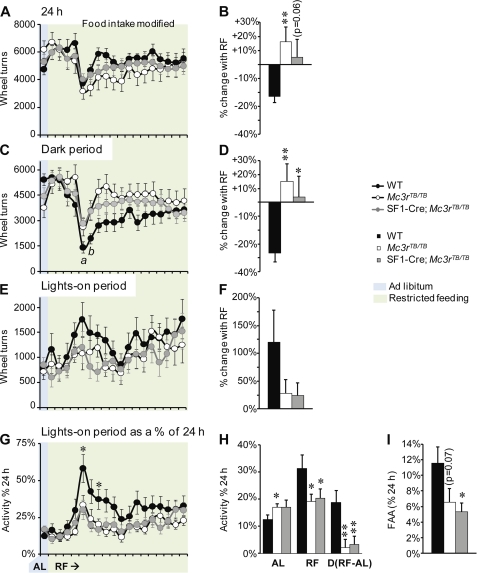
FIGURE 7.
Attenuated expression of FAA and altered locomotor response of Mc3rTB/TB mice to restricted feeding are not rescued in SF1-Cre;Mc3rTB/TB mice. After a 2-week acclimation period, Mc3rTB/TB mice weighed 10% more than WT and SF1-Cre;Mc3rTB/TB mice (body weight: for WT, 26.7 ± 0.8 g; for Mc3rTB/TB, 30.1 ± 1.1 g; and for SF1-Cre;Mc3rTB/TB, 27.7 ± 0.9; Mc3rTB/TB versus WT, p < 0.01; versus SF1-Cre;Mc3rTB/TB, p < 0.05). Note that for A, C, E, and G, the x axis is the same; activity during ad libitum feeding (AL) is in the blue shaded region. All mice were subject to 19 days of restricted feeding (RF). After 5 days of RF, the amount of food provided was increased incrementally to protect mice from excessive weight loss. A and B, restricted feeding results in reduced 24-h activity in WT mice, but not in Mc3rTB/TB mice (**, p < 0.01 versus WT). A shows daily activity during the course of RF, whereas B shows the averaged percentage of change in activity associated with RF. The behavioral phenotype may be partially improved in SF1-Cre;Mc3rTB/TB mice, with an intermediate change in activity. C and D, activity during the dark period was reduced in WT, but not in Mc3rTB/TB or SF1-Cre;Mc3rTB/TB mice, after 4–5 days of RF (*, p < 0.05 WT versus SF1-Cre;Mc3rTB/TB mice, **, p < 0.01 WT versus Mc3rTB/TB mice). E and F, RF was associated with increased activity in the lights-on phase in WT mice, and this response was attenuated in Mc3rTB/TB and SF1-Cre;Mc3rTB/TB mice. G and H, assessment of activity in the lights-on phase expressed as a percentage of total 24 h activity. RF increased the proportion of activity during the lights-on phase in WT mice only; note that this effect was attenuated when mice were presented more food to prevent excess weight loss. *, p < 0.05 versus WT and SF1-Cre;Mc3rTB/TB. The level of activity in the daytime as a proportion of total 24 h activity was higher in Mc3rTB/TB mice fed ad libitum. *, p < 0.05 versus WT, ** p < 0.01 versus WT. I, expression of FAA as a percentage of total activity; the data are averaged values during the course of RF. *, p < 0.05 versus WT.

