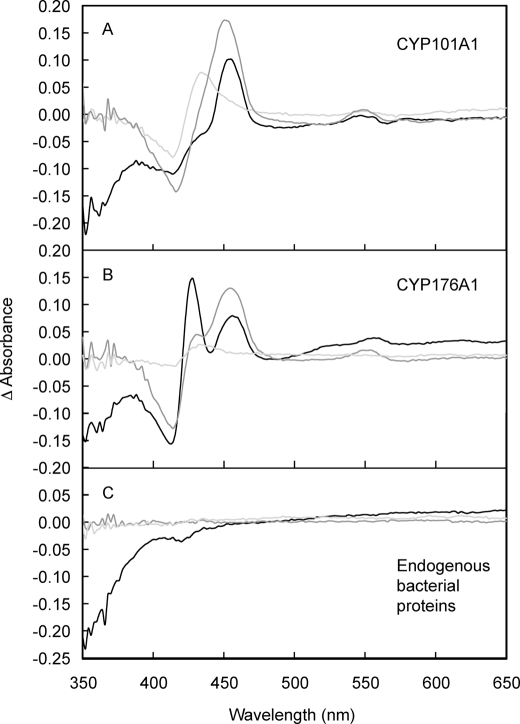
FIGURE 4.
Visible region absorption spectra induced by binding of nBIC to P450s in intact bacterial cells. Difference spectra were recorded in the presence and absence of 10 mm nBIC with E. coli expressing CYP101A1 (A), CYP176A1 (B), or no recombinant proteins (C), subjected to three different treatments: (i) incubation for 10 min with 10 mg/ml sodium dithionite (reduced sample, black lines), (ii) incubation with 10 mg/ml sodium dithionite followed by 10 min of vigorous agitation in air (oxidized sample, pale gray lines), or (iii) no treatment (native, dark gray lines).

