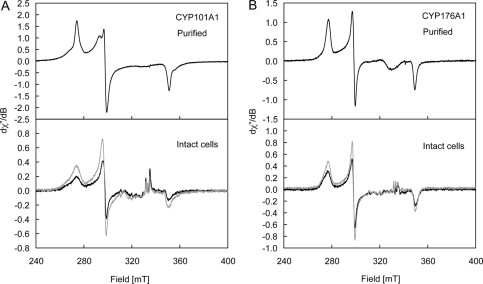
FIGURE 5.
X-band EPR spectra of purified (top panel) CYP101A1 (A; ∼300 μm in 50 mm Tris-HCl containing 50 mm KCl, pH 7.4, ν = 9.37728 GHz; top panel) and CYP176A1 (B; ∼21 μm in 100 mm potassium phosphate, pH 7.2, ν = 9.37715 GHz; top panel) and intact E. coli cells (bottom panel) expressing CYP101A1 (A) and CYP176A1 (B). Spectra of the native and oxidized samples are shown in black and gray lines, respectively, and were measured at 8.00 ± 0.02 K; g matrices are given under “Results.” The broad resonance of ∼330 mT in the purified enzymes arises from a Cu(II) impurity in the cavity. The relatively sharp resonances of ∼330 milliteslas in the whole cell spectra arise from slight differences in the concentrations of Mn(II) in the whole cell spectra and the control (no P450) sample. dχ′′/dB axes are relative.

