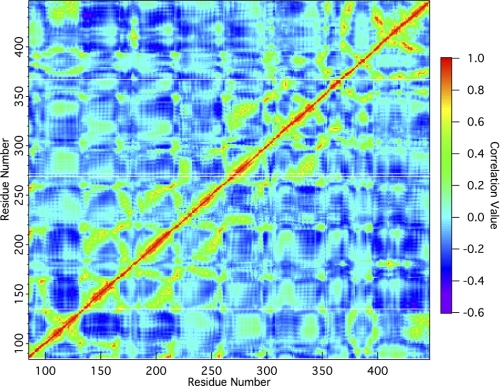
FIGURE 5.
Residue cross-correlation map of wild type Cel6A. A positive value denotes a positive correlation of motion, whereas negative values are indicative of negative correlation of motion. Zero represents a total lack of correlated modes. This map was calculated using the first 100 modes. Faint white lines running from left to right have been placed at locations on the map corresponding to Trp-135, Trp-269, Trp-272, and Trp-367.

