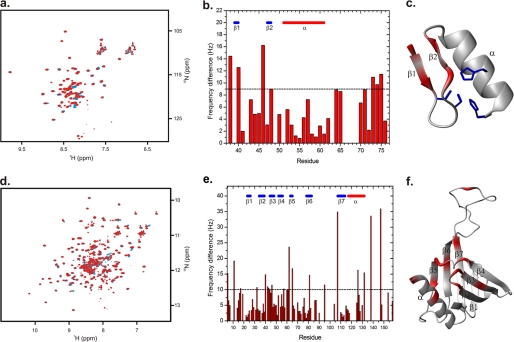
FIGURE 9.
Structural mapping of the HSPC038-ICln 1–159 interaction interfaces. a, overlay of 1H-15N HSQC NMR spectra of free HSPC038 (blue contours) and the HSPC038-ICln 1159 complex (red contours). b, absolute difference in resonance frequency (Equation 1) between free HSPC038 and the HSPC038-ICln 1–159 complex displayed against the primary sequence. Secondary structure elements are indicated in blue (β-strands) and in red (α-helix). c, HSPC038 residues with a frequency difference exceeding 9 Hz (dotted line in b) upon complex formation with ICln 1–159 are colored in red on the HSPC038 homology model. The zinc coordinating cysteine and histidine residues are shown as blue sticks. d, overlay of 1H-15N HSQC NMR spectra of free ICln 1–159 (blue contours) and the ICln 1–159-HSPC038 complex (red contours). e, absolute difference in resonance frequency (Equation 1) between free ICln 1–159 and the ICln 1–159-HSPC038 complex displayed against the primary sequence. Secondary structure elements are indicated in blue (β-strands) and in red (α-helix). f, ICln 1–159 residues with a frequency difference exceeding 10 Hz (dotted line in e) upon complex formation with HSPC038 are colored in red on conformer number one in Protein Data Bank code 1ZYI. Secondary structure elements defined previously (32) are indicated on the structure.

