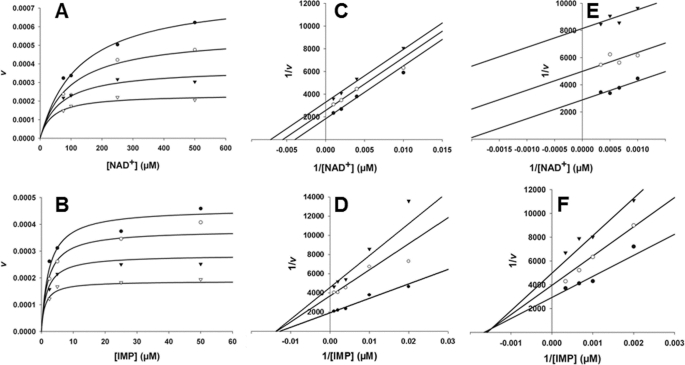
FIGURE 2.
Mechanism of MPA inhibition of fungal IMPDHs. A and B, AnImdA, [MPA] = 0 (●), 10 (○), 25 (▾), and 50 (▿) nm; [E] = 39 nm. A, versus NAD+, [IMP] = 500 μm, and Km = 10 μm. Data were fit to Equation 5. B, AnImdA versus IMP, [NAD+] = 500 μm, and Km = 170 μm. Data were fit to Equation 5. C and D, PbIMPDH-A, [MPA] = 0 (●), 200 (○), and 400 (▾) nm; [E] = 76 nm. C, versus NAD+, [IMP] = 2 mm, and Km = 130 μm. Data were fit to Equation 3. D, versus IMP, [NAD+] = 1 mm, and Km = 340 μm. Data were fit to Equation 4. E and F, PbIMPDH-B, [MPA] = 0 (●), 10 (○), and 25 (▾) μm; [E] = 71 nm. E, versus NAD+, [IMP] = 5 mm, and Km = 1.4 mm. Data were fit to Equation 3. F, versus IMP, [NAD+] = 5 mm, and Km = 0.79 mm. Data were fit to Equation 5. All fits were performed to nonlinear equations using SigmaPlot. Lineweaver-Burk plots are shown for inspection only.

