FIGURE 8.
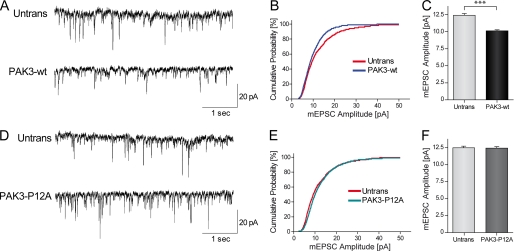
Expression of PAK3-WT down-regulates mEPSC amplitudes in hippocampal neurons through its interaction with Nck2. A, representative sample traces of 5 s recording of mEPSCs in untransfected or GFP-PAK3-WT transfected neurons. Scale bars, 20 pA and 1 s. B, cumulative distribution plots of the mEPSC amplitude, assembled from the first 100 events from each cell recorded. C, quantification of mean mEPSC amplitude (mean ± S.E.). n = 10–15 cells per condition; ***, p < 0.001, Mann Whitney test. D–F, sample traces, cumulative distribution and quantification of mEPSC amplitude (means ± S.E.) recorded in untransfected neurons and in neurons transfected with GFP-PAK3-P12A construct showed no difference. n = 15 cells per condition.

