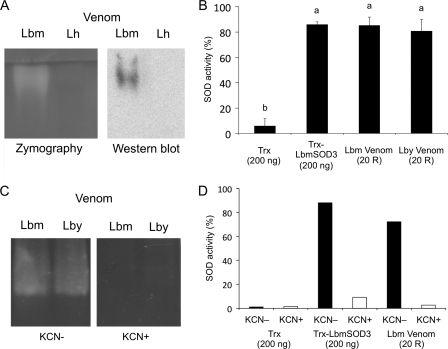
FIGURE 6.
SOD activity assays with venom. A, SOD zymography assay and Western blot experiment in native conditions with extracts of 25 Lbm and Lh venom reservoirs. B, SOD spectrophotometric assay using 200 ng of Trx-LbmSOD3 and protein extracts of 20 Lbm, Lby, and Lh venom reservoirs (20 R). Different letters above the bars designate significantly different values. C, SOD zymography assay using extracts of 25 Lbm and Lby venom reservoirs with (KCN+) and without KCN (KCN−). D, SOD spectrophotometric assay using 200 ng of Trx-LbmSOD3 and extracts of 20 Lbm reservoirs (20 R) with (KCN+) and without KCN (KCN−). Trx tag alone was used as a control.

