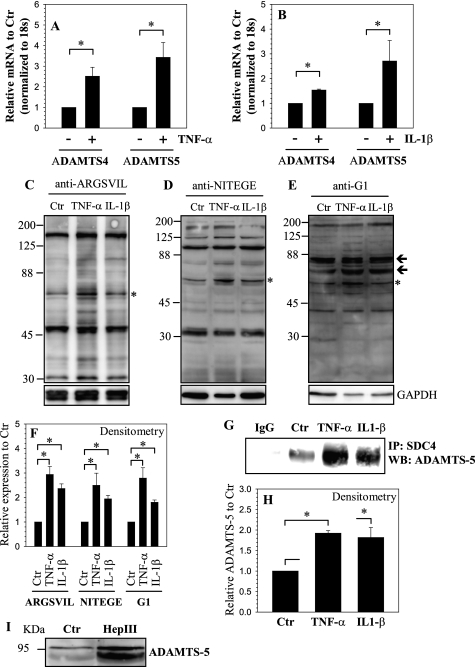
FIGURE 5.
Regulation of ADAMTS expression and activity by TNF-α and IL-1β. Real-time RT-PCR analysis of cells treated with A, TNF-α and B, IL-1β show increase in expression of ADAMTS-4 and ADAMTS-5. C–E, Western blot analysis to measure aggrecan degradation using neoepitope antibodies C, anti-ARGSVIL D, anti-NITEGE E, anti-G1. A prominent increase in degradation products corresponding to particular epitopes (marked by asterisk and arrows). F, densitometric analysis of three blots each for experiment described in C, D, and E above. GAPDH was used as a loading control and to calculate relative expression. Increase in degradation products corresponding to epitopes marked by asterisk in C–E was seen by the cytokine treatment. G, immunoprecipitation (IP) of SDC4 from control and cytokine-treated cells followed by a Western blot using ADAMTS-5 antibody shows increased association between SDC4 and ADAMTS-5 in treated cells. IP using an isotype IgG in place of SDC4 antibody showed absence of ADAMTS-5 co-precipitation. H, densitometric analysis of three blots for experiment described in G above shows increased co-precipitation of SDC4 and ADAMTS-5 in cytokine-treated NP cells. I, treatment of NP cells with heparinase (Hep) III resulted in increased shedding of pro-ADAMTS-5 in the medium. Values shown in quantitative experiments are mean ± S.E. from three independent experiments, *, p < 0.05.

