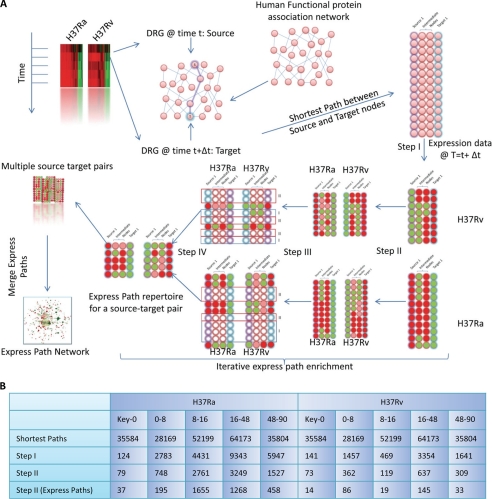
FIGURE 2.
EPA, a novel method for analyzing microarray data. The express path analysis strategy is schematically represented in A. The two contrasting environments for this study were THP1 cells infected with Ra and Rv, respectively; however, the approach is applicable to any set of contrasting environments. In the time course microarray experiment, DRGs between the two environments were identified at each of the time points. Then in the human functional protein association network (from the STRING database), the shortest paths were traced between DRGs at one time point to the following time point. The ensemble of shortest paths was then iteratively enriched based on their expression values in the respective environments, eventually yielding a set of shortest paths that are not similarly regulated at any of the nodes between the two conditions. Briefly, once the shortest path ensemble is created, in Step I, we filter out only those shortest paths that are significantly regulated at each of the intermediate steps. Because the expression of intermediates in the Ra- and Rv-infected cells is different, Step I yields a different subset of shortest paths for Ra and Rv. Note the different number of paths for Ra and Rv sets after Step I in the figure (for a given source-target pair). Also important to note here is the fact that the respective paths identified in either Ra or Rv sets were regulated (i.e. down-regulated (green) or up-regulated (red)) at each of the intermediate steps as well. In the next step (Step II), for the subset of pathways in the Ra set, corresponding expression of intermediates in Rv is monitored, and vice versa. If any of the intermediates for a shortest path shows a similar expression pattern in both Ra and Rv, that path is excluded out, consequently enriching differentially regulated paths or express paths. A similar exercise performed on all source-target pairs for a given time window is then merged together to get the shortest path network. The number of shortest paths remaining after every enrichment step is shown in B.

