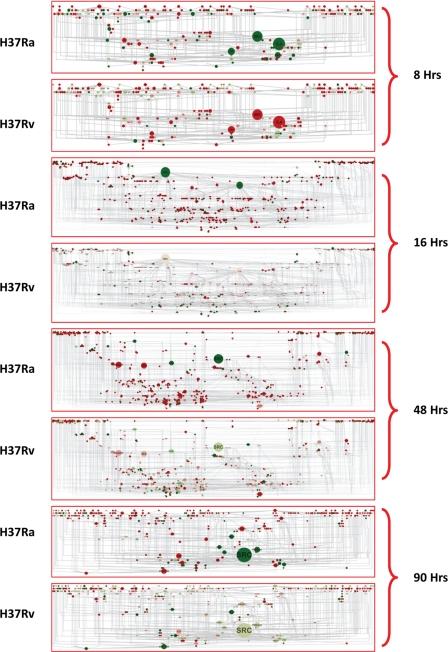
FIGURE 3.
Express path network identifies key regulatory nodes. The express paths identified through our analysis (Fig. 2, A and B) were then all merged together, from both Ra and Rv data sets for any given source-target pair time point. This resulted in a network of interaction due to the highly overlapping nature of express paths identified. Express path networks for each of the source-target pairs, along with the betweenness centrality visualization and relative expression differences between Ra and Rv, are represented. Large sized nodes will have a high betweenness value (i.e. more express paths utilize that particular molecule in order to reach the target molecules). Expression data from Ra- and Rv-infected cells were also incorporated into the network, red representing up-regulated genes and green showing down-regulated ones. Note the identical betweenness coefficients for the nodes between Ra- and Rv-infected cells and the largely distinct expression pattern between them.

