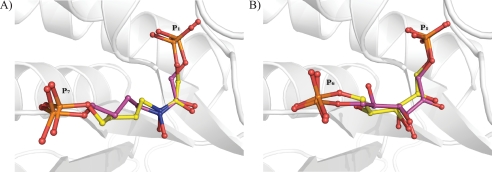
FIGURE 6.
Automated docking using AutoDock 4 to predict binding sites for substrate and inhibitor corresponding to cluster of lowest interaction energy in FBA-tb. A, comparison of the TD3 binding site as predicted by AutoDock 4 (yellow) and observed in the crystal structure of the high occupancy subunit of FBA-tb (magenta). B, comparison of the FBP binding site as predicted by AutoDock 4 (yellow) and observed in the crystal structure of a C-terminal His-tagged variant of FBA-tb (Protein Data Bank code 3elf) (magenta).

