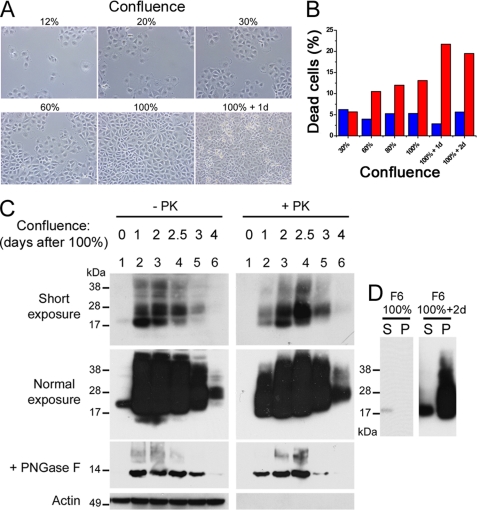
FIGURE 4.
Characterization of the aggregation correlated to confluence. A, different confluence states of F6 cells observed by bright field microscopy. B, flow cytometry quantification of propidium iodide-positive cells (dead cells) in E1 (blue) and F6 (red) cultures as a function of confluence. C, analysis of the electrophoretic profile of H2H3Flag, probed by M2 antibody, as a function of confluence. F6 were plated at day 0 by serial one half-dilution and analyzed at day 6, with (+) or without (−) PK digestion, loading 200 μg or 10 μg of total proteins, respectively. Top panels, two autoradiographic exposures were performed. Middle panels, aliquots of the samples were treated with PNGase F to assess the glycosylation status of the protein. Loaded amount of proteins corresponded to 1/10th of the upper panels load. Bottom panels, actin was used a normalization control. For lane 4, the date of confluence was intermediate between lanes 3 and 5. D, solubility assay. F6 cell lysates from 100% confluent and 100% confluent + 2 days cultures were separated as a detergent-soluble fraction (S) and pellet fraction (P) and probed by M2 antibody in Western blot.

