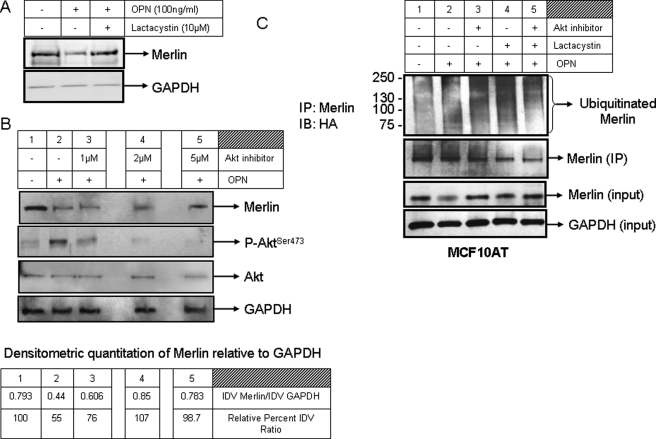
FIGURE 4.
OPN targets Merlin for Akt-mediated proteasomal degradation. A, OPN (100 ng/ml) causes a decrease in the levels of Merlin in SUM159 cells. Treatment with lactacystin (10 μm) rescues Merlin in the presence of OPN. B, in MCF7 cells that express endogenous Merlin, OPN treatment activates Akt (increased levels of phospho-Ser473-Akt (P-AktSer473, lane 2). The levels of total Akt remain unaltered. Akt inhibitor IV reduces levels of phospho-Akt and restores endogenous Merlin levels (lanes 3–5). The levels of phospho-Akt were assessed 8 h after treatment with recombinant human OPN and Akt inhibitor, whereas Merlin levels were scored 16 h after the treatment. IP, immunoprecipitation; IB, immunoblotting. C, OPN increases the levels of ubiquitinated endogenous Merlin (lane 2). The smear represents ubiquitinated Merlin. Lactacystin arrests the ubiquitinated Merlin, resulting in increased intensity of the signal (lane 4). Inhibition of Akt reduces the intensity of ubiquitinated Merlin (lane 5). MCF10AT cells were transfected with HA-ubiquitin and treated with OPN, lactacystin, and Akt inhibitor IV. Cell lysate (2 mg) harvested in Nonidet P-40 buffer was immunoprecipitated overnight for endogenous Merlin. The immunoprecipitate was immunoblotted with anti-HA antibody and anti-Merlin antibody. Merlin and GAPDH levels from the cell lysates are represented as inputs for the experiment. The band intensity of Merlin in all the lanes was quantitated relative to the respective GAPDH bands and is depicted in the accompanying table and represented as the ratio of integrated density values (IDV) and also as a relative percentage of integrated density value ratio (relative to lane 1, untreated cells). Densitometry was done using the AlphaEase program.

