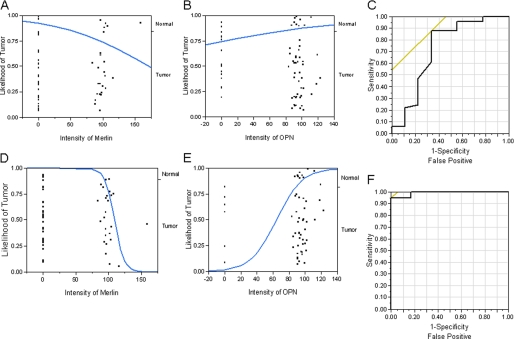
FIGURE 6.
OPN ameliorates tissue identification and discriminatory power of Merlin. The reciprocal relationship between Merlin and OPN was assessed by logistic regression and ROC curve analyses. A, logistic plot using Merlin as a predictor variable to distinguish between normal and tumor tissues. The effect likelihood test (p = 0.0448; ROC curve area = 0.722) indicates that Merlin has a discriminatory power for distinguishing between normal and tumor tissues. B, logistic plot of OPN as a predictor variable shows that OPN by itself is not reliably able to discriminate between normal and tumor tissues (p = 0.2872; ROC area = 0.6040). C, ROC curve for logistic model with Merlin and OPN as predictor variables to distinguish between normal and tumor tissues indicates that OPN does not augment the discriminatory power of Merlin (whole model test, p = 0.0517; ROC area = 0.7234). The effect likelihood tests show that although Merlin contributes significantly (p = 0.0286) to the prediction of tumor tissue, OPN does not (p = 0.1682). D, logistic plot using data from only the normal tissues that stained for Merlin and the entire dataset of tumor tissue staining for Merlin show that Merlin has a very high discriminatory power for distinguishing between normal and tumor tissues (p < 0.0001; ROC area = 0.93). E, logistic plot using data from only from the tumor tissues that stained for OPN and the entire dataset of normal tissue staining for Merlin show that OPN has discriminatory power for distinguishing between normal and tumor tissues (p < 0.0007; ROC area = 0.7023). F, ROC curve for logistic model utilizing non-zero Merlin values for normal tissues and non-zero OPN values for tumor tissues as predictor variables to distinguish between normal and tumor tissues indicates that OPN augments the discriminatory power of Merlin (whole model test, p < 0.0001; R2 = 0.81; ROC area = 0.9917). The effect likelihood tests show that both Merlin (p < 0.0001) and OPN (p = 0.0001) contribute significantly to the prediction of tumor tissue.

