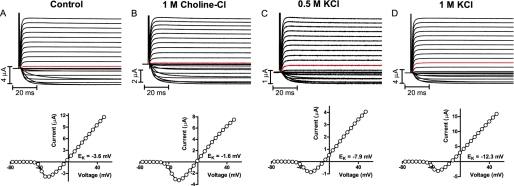
FIGURE 1.
Representative K+ current recordings (upper) and corresponding I(V) curves (lower) measured electrophysiologically in Kv channel-expressing Xenopus oocytes. A, data for control oocytes. B–D, data for oocytes injected with the indicated test solutions. The holding potential was set to −80 mV, and test pulses ranged from −80 to +50 mV. The current generated by stepping to 0 mV is marked in red in each recording.

