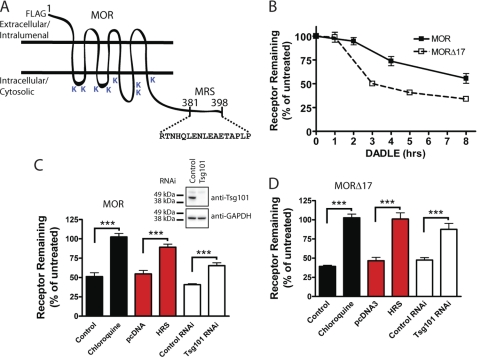
FIGURE 1.
Both MOR and MORΔ17 undergo ESCRT-dependent down-regulation by lysosomes. A, shown is a diagrammatic representation of the F-MOR and F-MORΔ17 constructs, indicating the location of cytoplasmic lysine residues and the previously identified MRS. B, shown is the time course of the down-regulation of F-MOR and F-MORΔ17. HEK293 cells stably expressing either receptor were incubated at 37 °C with 10 μm DADLE for the indicated time period, and then radioligand binding assay was carried out using the high affinity radiolabeled opioid antagonist [3H]DPN at 10 nm to estimate Bmax, as described under “Experimental Procedures.” Data points represent specific binding of [3H]DPN measured at each time point, expressed as a percentage of the specific binding in cells not exposed to agonist. Points represent mean determinations from independent experiments, with each time point analyzed in triplicate tubes in each experiment. Error bars represent the S.E. calculated across the experiments (n = 3–5). C and D, shown is the effect of the indicated experimental manipulations on DADLE-induced down-regulation of F-MOR (panel C) and F-MORΔ17 (panel D) in stably transfected HEK293 cells. Cells were transfected with “empty” pcDNA3 or pcDNA3-HRS (red bars) or transfected with control (scrambled) siRNA or siRNA targeting TSG101 (white bars). A final set of cells was pretreated with 200 μm chloroquine for 20 min before the start of the experiment (black bars). Cells were then left untreated or exposed to 10 μm DADLE for 5 h (F-MORΔ17, panel D) or 8 h (F-MOR, panel C), chosen according to the different down-regulation kinetics of these constructs, before carrying out the radioligand binding assay using 10 nm [3H]DPN. Bars represent the specific binding detected after agonist treatment, expressed as a percentage of that detected to identically manipulated cells except not exposed to agonist. In each experiment binding was determined in triplicate tubes. Bars represent average determinations, and error bars S.E., across multiple experiments (n = 3–6; ***, p = <0.001, two way ANOVA). The inset shows correlative immunoblot data verifying Tsg101 depletion by the siRNA.

