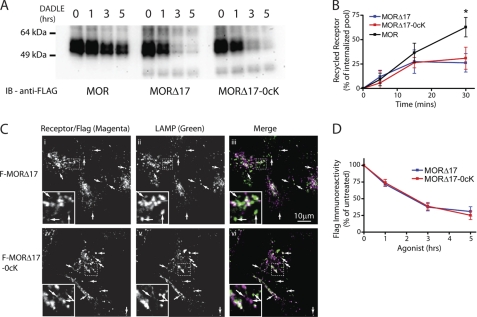
FIGURE 3.
MOR trafficking to lysosomes, assessed biochemically or immunochemically, does not require receptor ubiquitination and is dictated by the C-tail. A, representative anti-FLAG immunoblots (from three-six independent experiments) show the effects of exposing cells to 10 μm DADLE for the indicated time period on FLAG-tagged receptor signal detected in cell extracts. Stably transfected HEK293 cells initially expressing similar levels of F-MOR (left), F-MORΔ17 (middle), or F-MORΔ17–0cK (right) were analyzed. Numbers above each lane indicate the time period of DADLE incubation in hours. B, shown is a comparison of recycling between F-MOR (black) F-MORΔ17 (blue) and F-MORΔ17–0cK (red). Stably transfected cells expressing the indicated receptor construct were incubated for 30 min in the presence of 10 μm DADLE to drive endocytosis and then washed and incubated at 37 °C in the presence of 10 μm naloxone for the indicated times before surface labeling of Alexa647-conjugated M1 anti-FLAG and quantifying surface receptor immunoreactivity by flow cytometry. Displayed are the proportion of internalized receptors that recovered to the plasma membrane at the indicated time point after agonist washout, calculated as described under “Experimental Procedures” (mean ± S.E., n = 3–4; *, p < 0.05, two-way ANOVA, Bonferroni post-test). C, shown are representative confocal micrographs showing the localization of F-MORΔ17 (i–iii) or F-MORΔ17–0cK (iv–vi) relative to LAMP1/2 immunoreactivity in stably transfected HEK293 cells fixed after exposure to 10 μm DADLE for 90 min. Merged images (iii and vii) display receptor and LAMP channels pseudocolored in green and magenta, respectively, with areas of colocalization appearing white. Insets show a magnified region of the image as illustrated by the dotted box. Arrows indicate puncta that appear to be only single colors due to differences in relative intensity of one or the other label but are in colocalized when examined at the level of individual images. D, quantification of agonist-induced proteolysis of F-MORΔ17 and F-MORΔ17–0cK, derived from multiple experiments corresponding to the example shown in panel A, were determined by exposure of anti-FLAG immunoblots in the linear detection range and scanning densitometry. Points indicate mean and error bars S.E. (n = 6 experiments).

