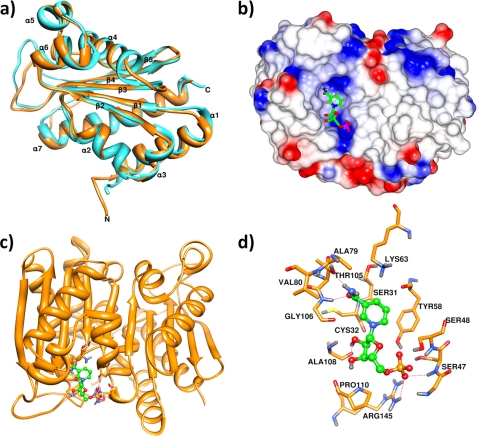
FIGURE 6.
Structural analysis of NMN deamidase. a, ribbon representation of E. coli PncC (cyan) superposed to A. tumefaciens PncC monomer (Protein Data Bank code 2A9S; orange), showing the domain organization. b, electrostatic surface of the 2A9S dimer; positive charges are in blue, and negative charges are in red. A NMN molecule in the proposed binding site is shown in ball and stick representation. c, ribbon representation of the 2A9S dimer, rotated by 45 °C with respect to b, in complex with NMN. d, detailed view of the interactions between 2A9S and NMN. Hydrogen bonds are indicated as dotted red lines.

