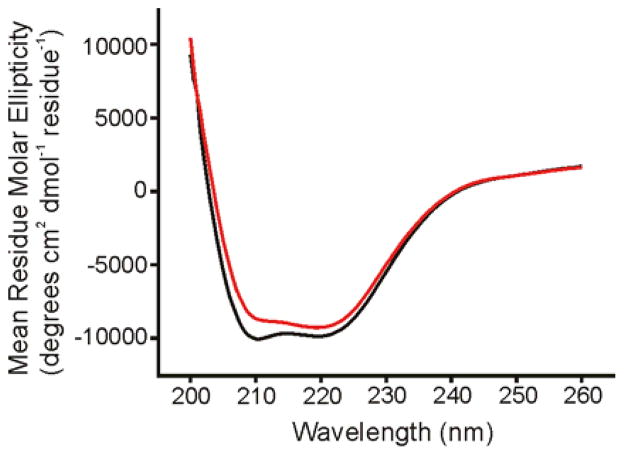
Figure 5.
CD spectra of Fgp41 at 25 °C. The black trace is for a sample which had not been heated and the red trace was obtained after heating to 100 °C with subsequent cooling to ambient temperature. Each trace is the difference between the CD spectrum of Fgp41 + buffer and the spectrum of buffer alone. The similarity of the red and black spectra support the reversibility of any thermal denaturation of Fgp41. Fgp41 samples were prepared by precipitation of excess SDS, subsequent dialysis in HEPES/MES buffer at pH 7.4, and addition of DTT at two times the molar concentration of Fgp41 to inhibit disulfide bond formation. For these spectra, [Fgp41] = 20 μM. Spectra for other Fgp41 samples were similar with minima near 208 and 222 nm that were diagnostic of α helical structure. In some spectra, the θ222 could be as low as –15000 degrees-cm2-dmol−1.

