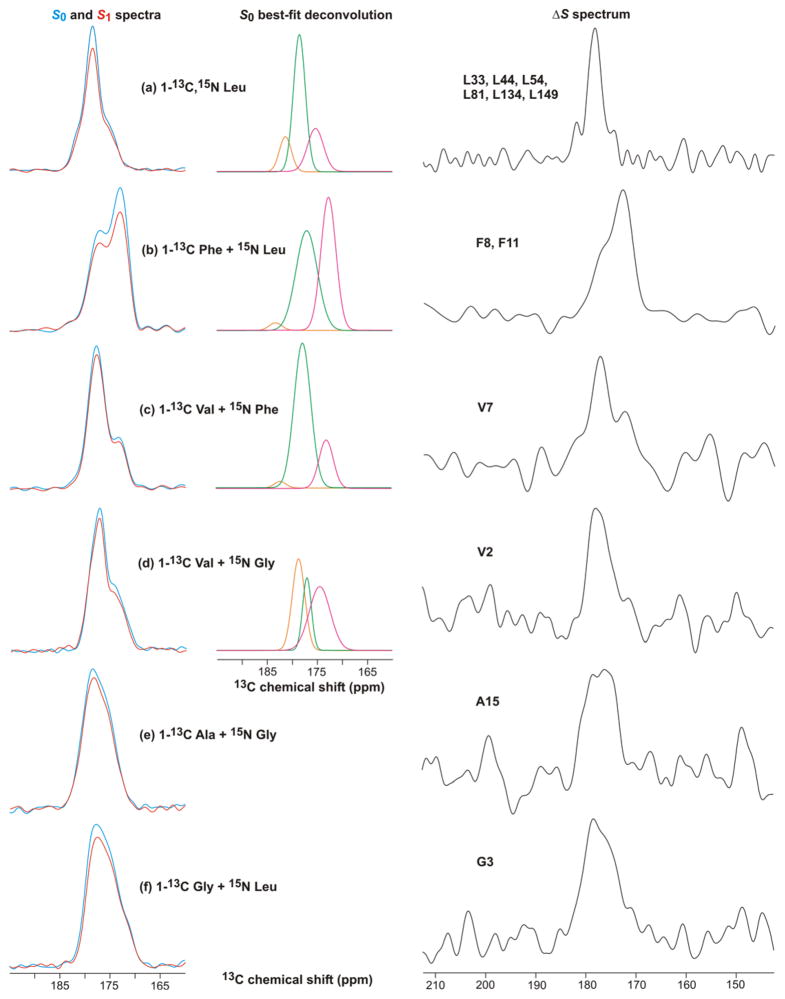
Figure 8.
REDOR 13CO NMR spectra of Fgp41 reconstituted in membranes. The labeled amino acid(s) in the expression medium are shown. The left panels displays S0 (blue) and S1 (red) spectra, the middle panels display the best-fit Gaussian deconvolutions of the S0 spectra, and the right panels display the ΔS ≡ S 0 – S1 spectra. The REDOR dephasing time was either (a) 1 ms or (b–f) 2 ms and the dominant contribution to each ΔS spectrum was from residues with labeled 13COs which were directly bonded to labeled 15Ns. These residues were: (a) L33, L44, L54, L81, L134, and L149; (b) F8 and F11; (c) V7; (d) V2; (e) A15; and (f) G3. Each S0 or S1 spectrum was processed with 100 Hz Gaussian line broadening and each ΔS spectrum was processed with either (a, b) 100 Hz or (c–f) 200 Hz line broadening. Polynomial baseline correction (typically 5th order) was applied to each spectrum. Each S0 or S1 spectrum was the sum of: (a) 93424; (b) 115610; (c) 109504; (d) 110736; (e) 165216; or (f) 103717 scans.

