Fig. 3.
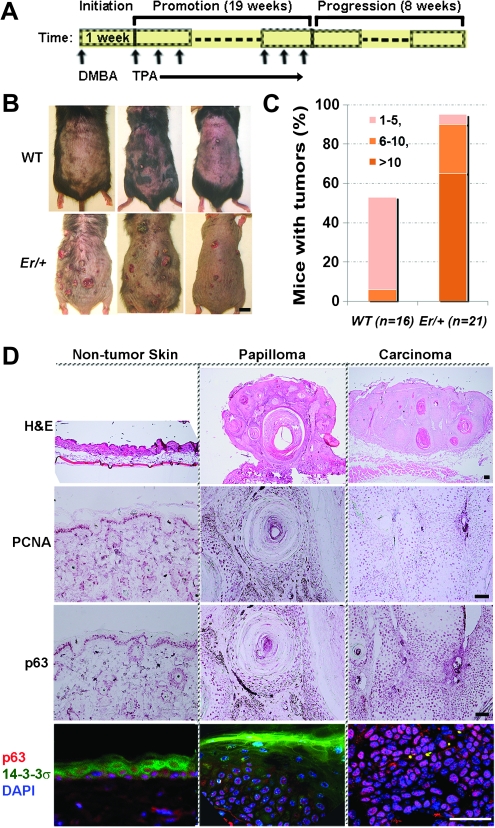
p63-positive cells are associated with DMBA-/TPA-induced tumors derived from Er/+ mice. (A) Schematic diagram shows a DMBA/TPA two-stage tumor induction procedure. About 100 nmol of DMBA in 0.2 ml acetone was applied topically to the shaved dorsal skin. One week after the single DMBA treatment, TPA was (17 nmol in 0.2 ml acetone) applied topically to the shaved dorsal skin for three times per week for 19 weeks. Eight weeks after stopping TPA treatment, the tumors were collected and processed for histopathological examination. The vertical arrows indicate the drug administration times. (B) Representative images showing induced tumors on the WT (top) and Er/+ (bottom) mice by the end of the two-stage DMBA/TPA tumorigenesis protocol. Scale bar: 1 cm. (C) The percentage of mice carrying the indicated numbers of papillomas in total DMBA-/TPA-treated mice is shown (WT, n = 16; Er/+, n = 21). The numbers in the table legend represent the number of tumors per tumor-carrying mouse. (D) Representative photographs of hematoxylin and eosin, immunohistochemistry (cell proliferating nuclear marker or p63), and double immunofluorescence of 14-3-3σ (green) and p63 (red) counterstained by DAPI in blue on the skin tissues without tumor (left), papillomas (middle) and carcinomas (right) collected from the tumor-induced Er/+ mice. Scale bars: 50 μm.

