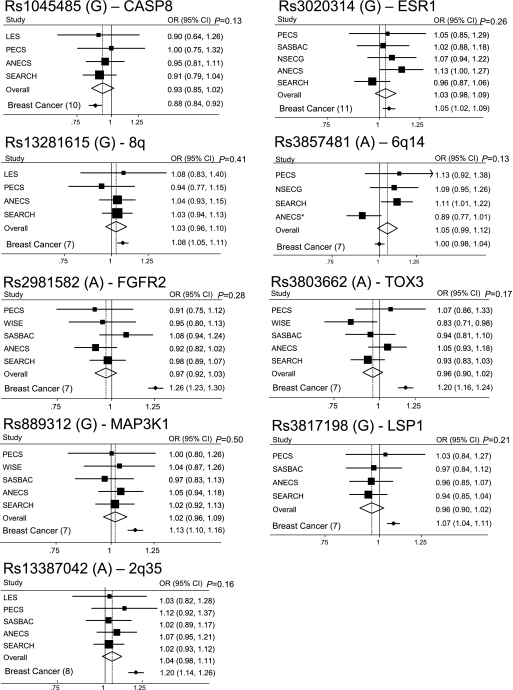
Fig. 1.
Forest plots showing per allele OR and 95% CIs for each SNP (risk allele) by study. The size of the black box is proportional to the study size. The diamond represents the OR and 95% CIs for the meta-analysis of each SNP. Per allele ORs and 95% CIs for breast cancer (reference in brackets) are shown for comparison at the bottom of each Forest plot. *Results for ANECS rs3857481 were imputed using a subset of the ANECS cases (n = 599) (5) matched to an alternative control group (1958 Birth Cohort controls n = 2694 and National Blood Donor controls n = 2496) (21).

