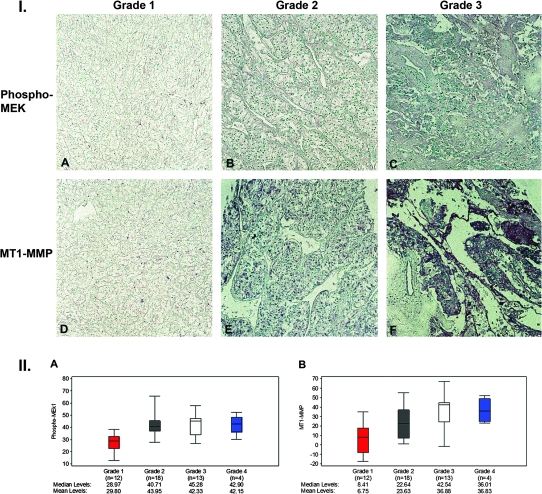
Fig. 6.
Representative sections of sections from renal carcinoma tissue microarray stained for phospho-MEK1 and MT1-MMP and quantitative assessment of phosphor-MEK1 and MT1-MMP expression as a function of nuclear grade. Panel I: Tissue microarrays were stained for phosphor-MEK1 and MT1-MMP as detailed in Materials and Methods. Phospho-MEK1 and MT1-MMP expression are increased in tumors with higher Furhman nuclear grade (×200). Panel II: Digitized immunohistologic images were quantified for phosphor-MEK1 and MT1-MMP expression as detailed in Materials and Methods and analyzed according to nuclear grade. The median is indicated by the black center lie and the interquartile range (first and third quartiles) are the edges of the boxes. Whiskers denote Q1 −1.5 × interquartile range and Q3 +1.5 × interquartile range. Tumor grade is significantly associated with both phosphor-MEK1 and MT1-MMP (r = 0.44/P = 0.002 and r = 0.56/P < 0.0001, respectively, Spearman correlation coefficients).

