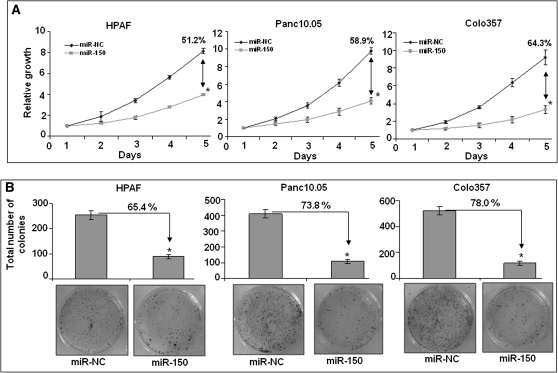
Fig. 4.
miR-150 decreases growth and clonogenicity of PC cells. (A) HPAF, Panc10.05 and Colo357 cells (2 × 10³ per well) were seeded in 96-well plates. After 24 h, cells were treated with either miR-150 mimic or non-targeting control (miR-NC) mimic and growth was monitored by WST-1 assay every day for next 5 days. After analysis, data were presented as relative growth induction (in folds) compared with growth at day 1. Growth inhibition of miR-150-transfected PC cells was calculated in comparison with miR-NC transfected PC cell on fifth day and shown as percentage. Bars represent mean ± SD; (n = 3); *P < 0.05. (B) Cells were transfected with miR-150 or miR-NC mimic and 48 h later, cells were trypsinized and seeded in six-well plate (1 × 10³ cells per well) for clonogenicity assay. After 2 weeks, colonies were stained with 0.1% crystal violet, photographed and counted using imaging system. Data were presented as percent inhibition of clonogenic ability of miR-150-transfected cells as compared with their respective controls. Bars represent the mean of total number of colonies ± SD (n = 3); *P < 0.05.

