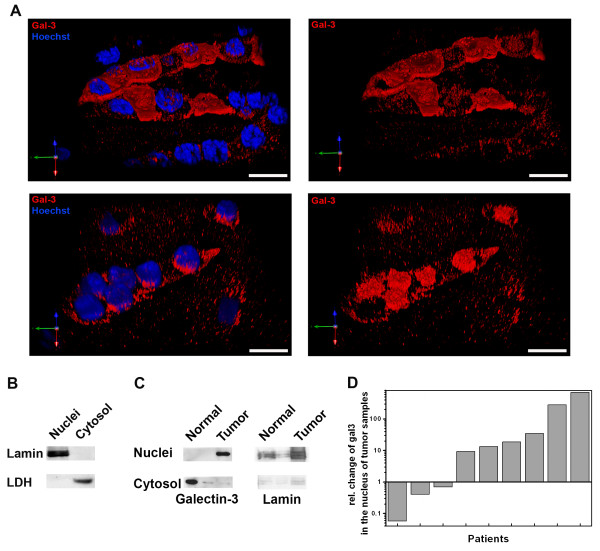
Figure 4.
Nuclear localization of galectin-3 in normal and tumor tissue samples. A. Immunofluorescence of galectin-3 and nuclear Hoechst was recorded in different layers of normal and CCRCC tissues. The recorded image stacks were processed by deconvolution and background elimination. Dual colors are depicted in the 3D-reconstructed images. On the left galectin-3 (red) is shown; nuclei are depicted in blue. Images without nuclear staining are depicted on the right. Scale bars: 15 μm. B. Immunoblots of nuclear lamin and LDH in isolated nuclei or cytosolic fractions. C. Imunoblots of galectin-3 or lamin in nuclear or cytosolic fractions from normal or tumor tissue. D. Relative changes in nuclear versus cytosolic localization as quantified from 9 immunoblots from normal or CCRCC tissues are depicted.

