Figure 4.

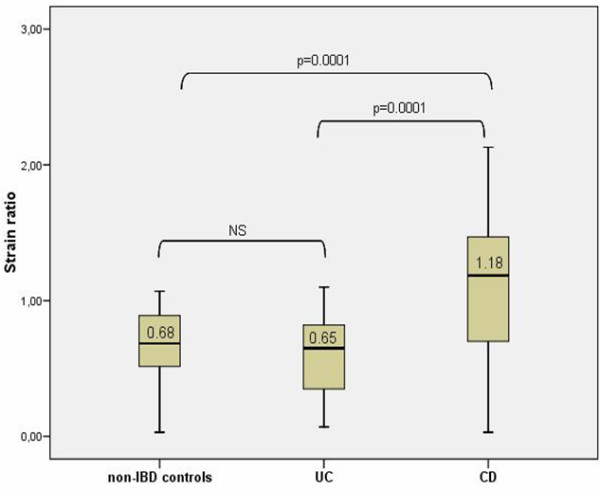
Strain ratio of non-IBD controls, CD and UC patients. Box plots indicate 25th and 75th percentile. Medians are represented by straight lines. Error bars indicate 5th and 95th percentiles.

Strain ratio of non-IBD controls, CD and UC patients. Box plots indicate 25th and 75th percentile. Medians are represented by straight lines. Error bars indicate 5th and 95th percentiles.