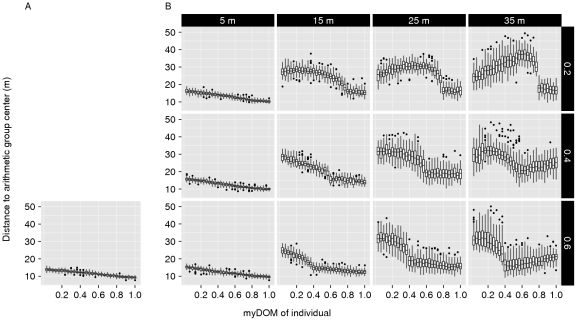
Figure 4. Centrality of dominants.
This figure shows the relationship between an individual's dominance strength (myDOM) and its centrality (distance to the arithmetic center of the group in meters) for different models. (A) Fleeing model. (B) Avoidance model (with different combinations of AV_DOM_DIFF (vertically, 0.2–0.4) and AV_DIST (horizontally, 5–35 m). Small distances to the arithmetic group center indicate more central positions. When the relation between dominance strength and centrality is steeper, centrality of dominants is more pronounced. Depending on the model, a low myDOM further implies low win chance and thus frequently employed fleeing behavior (fleeing and avoidance model) and frequently employed avoidance behavior (avoidance model). Boxplots show values of 50 simulation runs, averaged over time.

