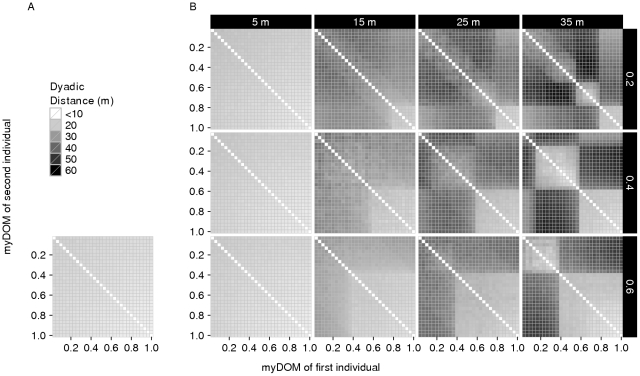
Figure 7. Spatial structure.
This figure shows the distribution of dyadic distances (in meters) among the individuals of a group for different models. (A) Fleeing model. (B) Avoidance model (with different combinations of AV_DOM_DIFF (vertically, 0.2–0.4) and AV_DIST (horizontally, 5–35 m). The x-axis shows the dominance strength (myDOM) of the first individual and the y-axis the dominance strength of the second individual per dyad. For further implications of an individual's dominance strength depending on the model, see the Figure 4 legend. Plots show the mean values of 50 simulation runs, averaged over time. Darker shades represent larger dyadic distances. Values at the diagonal are by default not applicable. Note that the distance matrices are by definition symmetrical.

