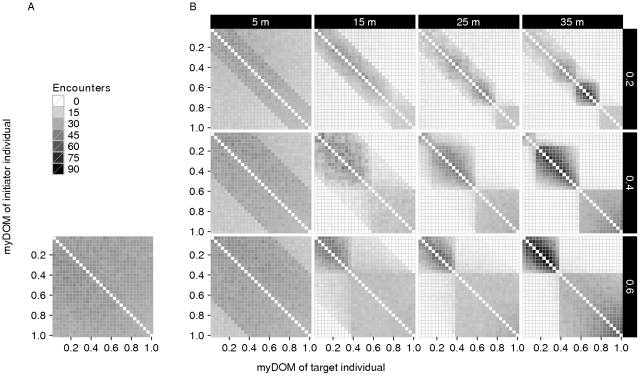
Figure 8. Encounter structure.
This figure shows the distribution and direction of encounters among the individuals of a group for different models. (A) Fleeing model. (B) Avoidance model (with different combinations of AV_DOM_DIFF (vertically, 0.2–0.4) and AV_DIST (horizontally, 5–35 m). Encounters are directed from initiators (y-axis) to targets (x-axis), both are ordered by dominance strength (myDOM). For further implications of an individual's dominance strength depending on the model, see the Figure 4 legend. Plots show the mean values of 50 simulation runs. Dark shades represent frequent encounters. Values at the diagonal are by default not applicable.

