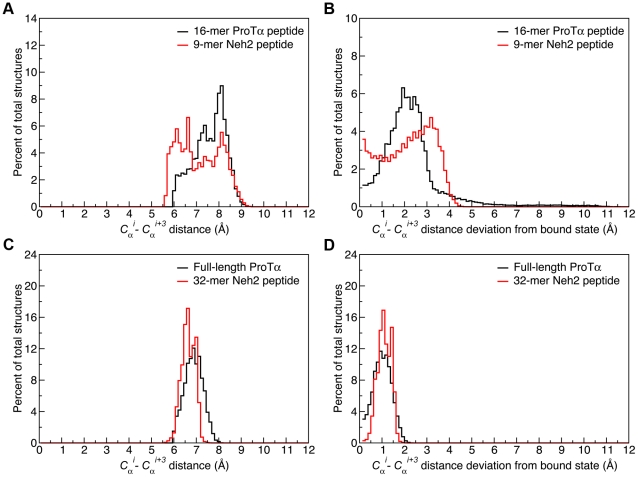
Figure 3. Cαi−Cαi+3 distances and their deviations from their crystal structure distances.
Panels A and C show the C αi−C αi+3 distances. Panels B and D show the absolute deviations of C αi−C αi+3 distances from the corresponding distances in the crystal structures. Data were collected over the full 1.0 µs trajectories for the crystal structure peptides and the last 0.1 µs for the full-length ProTα and 32-mer Neh2. Deviations were calculated for C αi−C αi+3 pairs from the β-turns, determined from the crystal structures [50], [55], by subtraction of the i to i+3 distance at time t of the trajectory from the fixed distance of the corresponding atom pair from the crystal structures (PDB ids: 2Z32 and 1X2R) for ProTα and Neh2 respectively) [50], [55].

