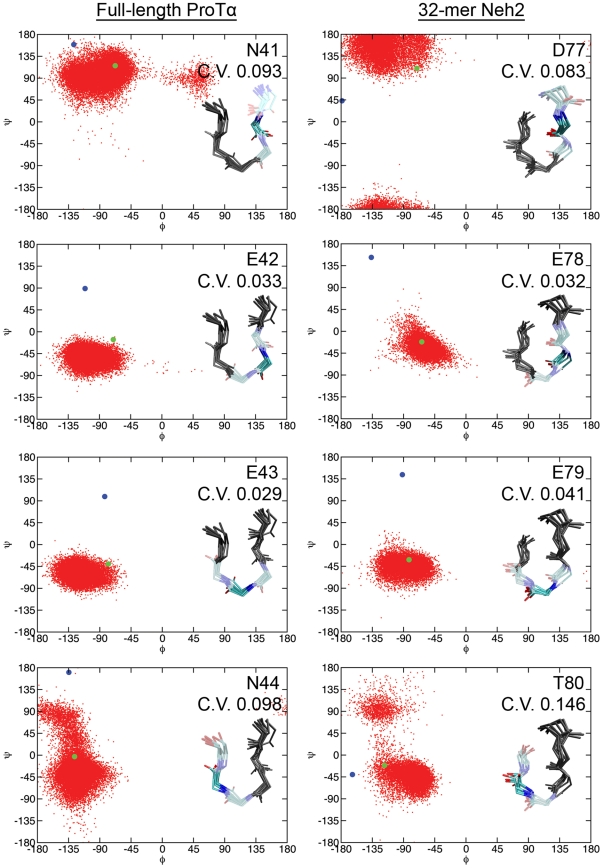
Figure 5. Ramachandran plots for residues i to i+3 of the β-turns from the MD and crystal structures.
Red dots indicate the ϕ and ψ pair from the last 0.1 µs of the full-length ProTα and the 32-mer Neh2 trajectories. Blue circles indicate the angles of the starting structures. Green circles indicate the ϕ and ψ angle pair from the crystal structures (PDB ids: 2Z32 and 1X2R) [50], [55]. Circular variance (C.V.) values and overlaid licorice representation snapshots from the last 0.1 µs of the simulations illustrate backbone mobility within the β-turns of ProTα and Neh2. Average circular variance values were calculated over the last 0.1 µs of the full-length ProTα and the 32-mer Neh2 peptide MD trajectories using the method described by MacArthur & Thornton [73].

