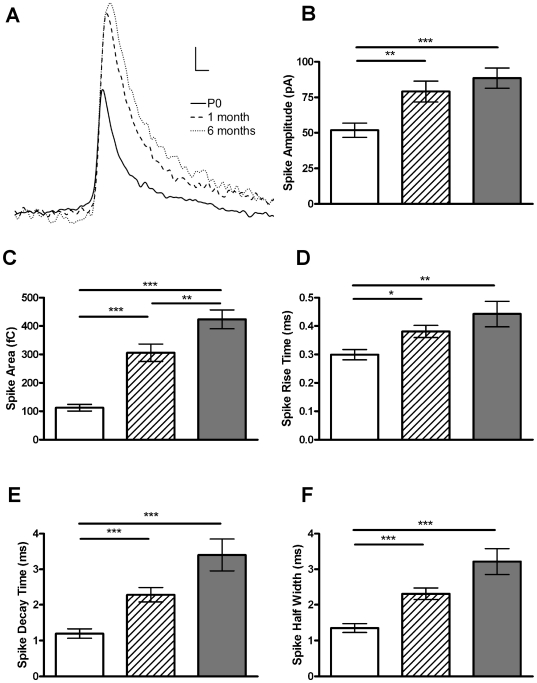
Figure 4. Aging alters the kinetics of full fusion.
(A) Examples of a typical amperometric spike at P0, 1 month and 6 months. Increases in spike amplitude (B), area (C), rise time (D), decay time (E) and half-width (F) are all evident, indicating that release kinetics and the amount released from each vesicle increases with age. Graphs represent the mean of each cells median value ± SEM. *, p<0.05; **, p<0.01; ***, p<0.001, calculated by Mann-Whitney U tests. n = 14, 15 and 16 for P0 (white bar), 1 month (striped bar) and 6 month (grey bar), respectively. Scale bars in (A) represent 10 ms and 10 pA.

