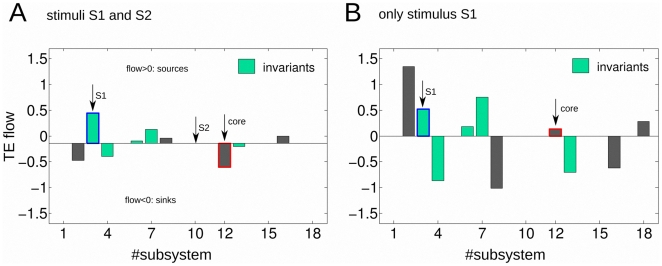
Figure 6. Transfer Entropy flow and metabolic functional invariants.
A: both stimuli S1 and S2 are presented to the network. B: only stimulus S1 is presented. A,B: Transfer Entropy flow is defined as the out-ward TE minus the in-ward. Now connections are weighted, so the TE flow is different to the net TE in Fig. 5 where we only counted the number of connections in each direction with no consideration of the connections weight. Positive values of flow are corresponding with sources and negative values with targets or sinks. The subsystem attribute is the being of a source or a sink. Functional metabolic invariants are the subsystems with no changes on their attributes along the two stimulation conditions (left and right columns). This happened for enzymatic subsystems MSb3, MSb4, MSb6, MSb7 and MSb13 (bars colored in light green). The non-invariant subsystems were colored in gray. With a red line on subsystem MSb12 we marked the nucleus. With a blue line on subsystem MSb3, we marked that this subsystem in addition to be an invariant, it did neither change its magnitude, possibly encoding the external stimuli S1.

