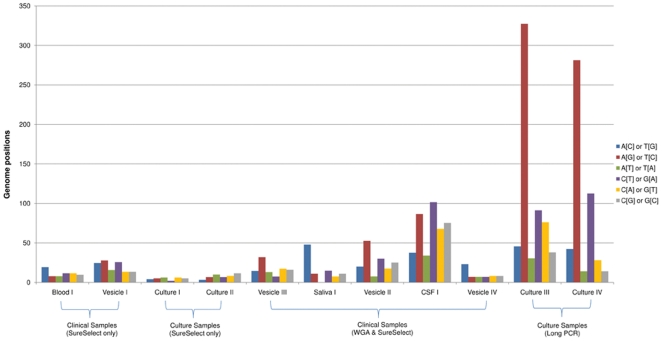
Figure 3. Mutational spectra of minority variants occurring within clinical samples.
Each bar indicates the number of genome positions at which specific allele combinations (see graphic) are present (minor allele frequency 1–10%). Datasets are normalised (corrected for the total number of mapped reads per sample) and show a clear bias toward A to G and T to C substitutions in samples prepared by long PCR. No bias was observed in samples prepared using target enrichment methods.

