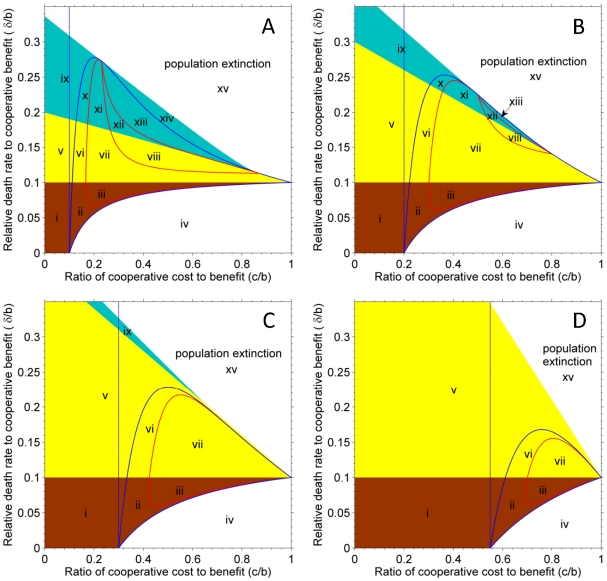
Figure 1. The dependence of dynamical behaviors on model parameters.
Brown part and part iv,  , have two boundary equilibriums: one for cooperators; the other for defectors. Yellow part,
  , has only one boundary equilibrium for cooperators. Cyan part,
  , has two boundary equilibriums both for cooperators. The area encircled by blue curves indicates the existence of interior equilibrium of cooperation-defect coexistence. The three red lines on (A) and (B), from bottom to top, indicate the node-focus bifurcation, Hopf bifurcation and the heteroclinic bifurcation, respectively, and the red lines on (C) and (D) indicate the node-focus bifurcation. Area on the left side of the vertical dotted line indicates the invasion condition for cooperation in the frequency-dependent selection (i.e.
  ). Parameters are
  and m = 0.1, 0.2, 0.3 and 0.55, respectively, for panel (A) to (D).

