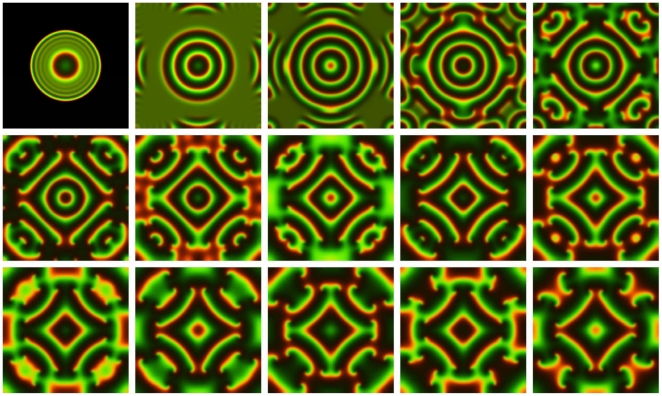
Figure 3. Spatial patterns of the ecological PDG on a 401×401 lattice.
The color brightness indicates the probabilities that each site is occupied by a cooperator (red) or a defector (green), or remains empty (black) (as in Wakano et al. 2009). Initially, the central site is occupied by a cooperator with a probability of 0.1 or by a defector with the same probability, and the other sites are completely empty. Parameters are the same as Fig. 2 viii as for the dynamics of periodic oscillation. First snapshot is taken at time 1500; the others start from time 4500, with a temporal interval of 1500 time steps. See Animation S2 and Appendix S3 for details.

