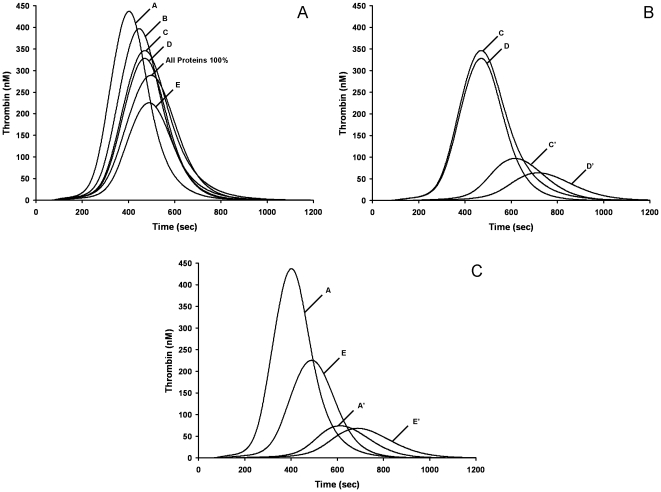
Figure 4. Model representation of hypothetical warfarin anticoagulation of control individuals.
cTGPs are presented for individuals before (e.g. A) and after hypothetical warfarin therapy (e.g. A') achieved by setting all VKD proteins at 33% their mean physiologic values with other factors retaining their individual specific values. Panel A: cTGPs of 5 control individuals with an additional cTGP representing an individual with all factors at 100% mean physiologic level. Panel B: 2 individuals with the most disparate thrombin generation profiles prior to anticoagulation. Panel C: 2 individuals with the most similar thrombin generation profiles prior to anticoagulation.

