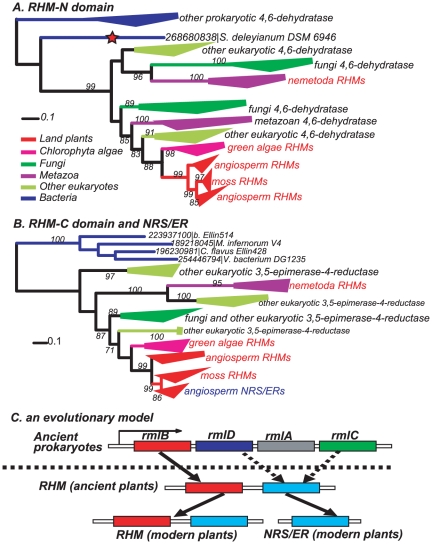
Figure 4: Phylogenies of 254 RHM N-terminal and 78 C-terminal domains.
A) 254 sequences closest to plant RHM N-terminal domains. The red star indicates the closest bacterial homolog of eukaryotic 4,6-dehydratases. B) 78 sequences closest to plant RHM C-terminal domains and plant NRS/ER proteins; these sequences were obtained by searching a self-built plant NRS/ER HMM against the NCBI-nr database (E-value <1e-2). The phylogenies are built using FastTree v2.1.1 and displayed using the Interactive Tree of Life (iTOL) web server. Major clades are collapsed as triangles and selected supporting values >70% are shown. Un-collapsed sequences are indicated using GenBank gi numbers followed by species names. The complete phylogenies with un-collapsed clades are given in Figures S3 and S4. C) A proposed model for the evolutionary route of the bi-domain RHMs and the single-domain 3,5-epimerase-4-reductases (NRS/ERs) in plants. The prokaryotic gene cluster is an example from Salmonella enterica serovar Typhi CT18 (Parkhill et al., 2001). Note that in different bacteria the order of the four genes could vary and some of the genes could be missing or replaced by other genes.

