
Figure 2.
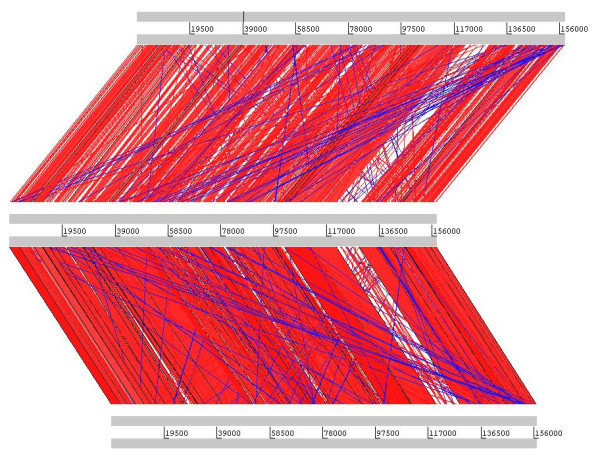
Artemis Comparison Tool (ACT) analysis of the genomes of SboM-AG3 (top), ΦSH19 (middle), and Vi01 (bottom).
Official websites use .gov
A
.gov website belongs to an official
government organization in the United States.
Secure .gov websites use HTTPS
A lock (
) or https:// means you've safely
connected to the .gov website. Share sensitive
information only on official, secure websites.
Artemis Comparison Tool (ACT) analysis of the genomes of SboM-AG3 (top), ΦSH19 (middle), and Vi01 (bottom).