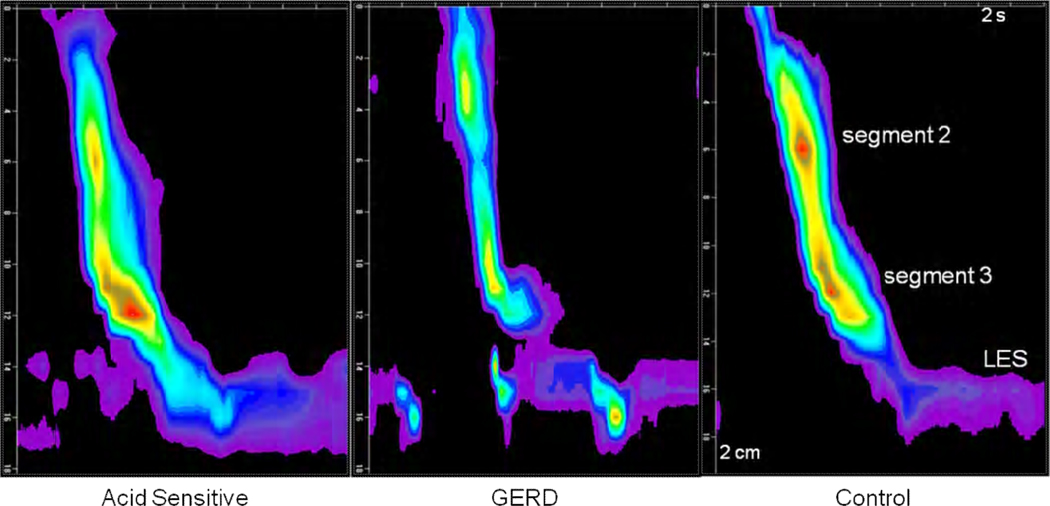
FIGURE 1.
Examples of Clouse plots showing the two smooth muscle contraction segments (segment 2 and segment 3) and the lower esophageal sphincter (LES) in the three subject groups. The two segments are symmetrical in length and amplitude in GERD and control subjects. In contrast, there is a visually conspicuous shift in peak contraction amplitude and segment length to segment 3 in the example from an acid sensitive subject.

