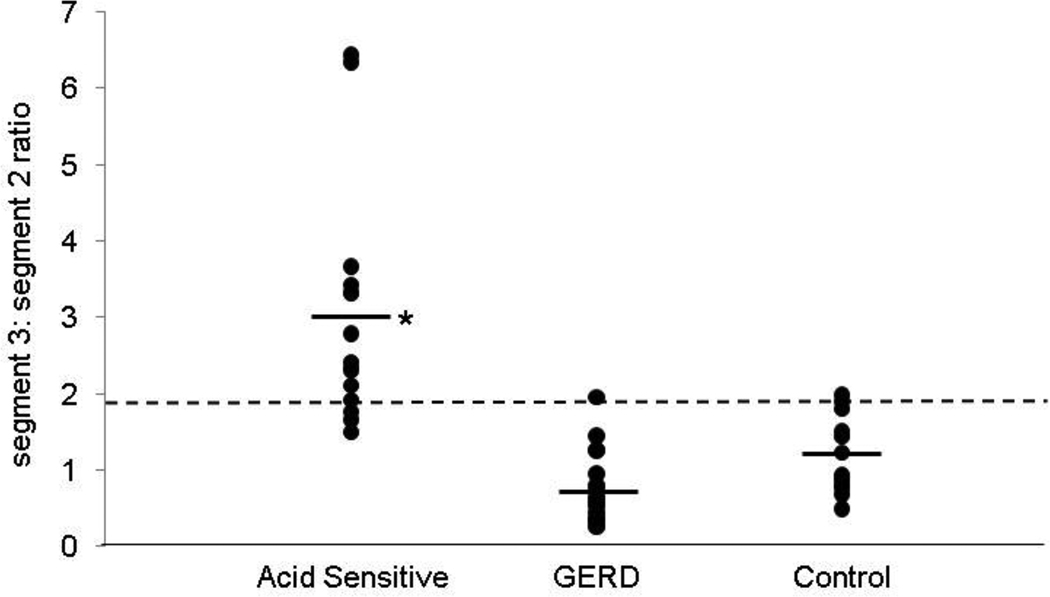
FIGURE 4.
Comparison of pressure volume ratio (segment 3:segment 2) in the three groups. When averaged, this ratio was significantly higher in the acid sensitive group compared to the other two groups (*p<0.001). A threshold ratio of 2.0 had the highest sensitivity (100%) in segregating acid sensitive subjects from GERD and control groups, while a ratio of 1.9 provided better performance characteristics (sensitivity 87%, specificity 90%).

