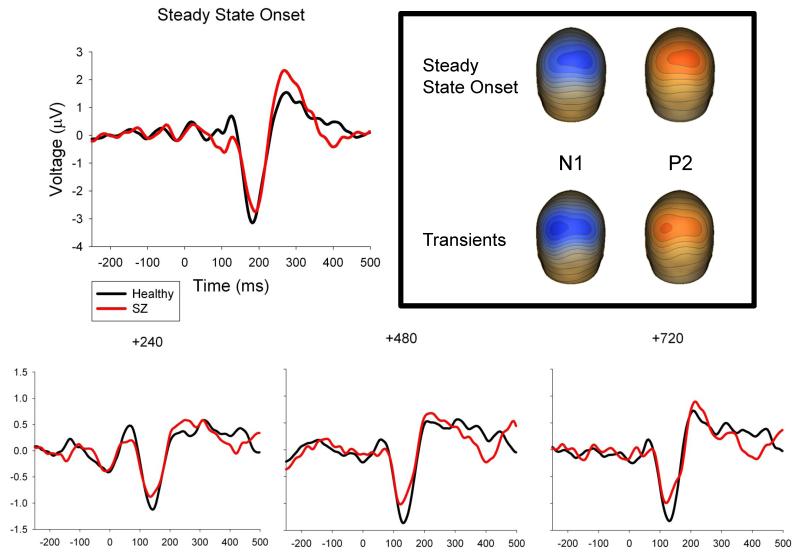
Figure 2.
ERPs to steady-state stimulus onset and transient stimuli. ERPs represent the weighted average of the sensor weights for the first two PCA components for that condition applied to each individual’s data and then averaged over the entire head. Topographies illustrate the weighted average of the first two PCA components for the steady-state onset and the averaged transient stimuli at the N1 and P2 peaks. Transient ERPs are differentially scaled from steady-state onset ERP in order to best show the peaks of interest, therefore absolute differences in peak amplitude between groups should be noted according to the scale.

