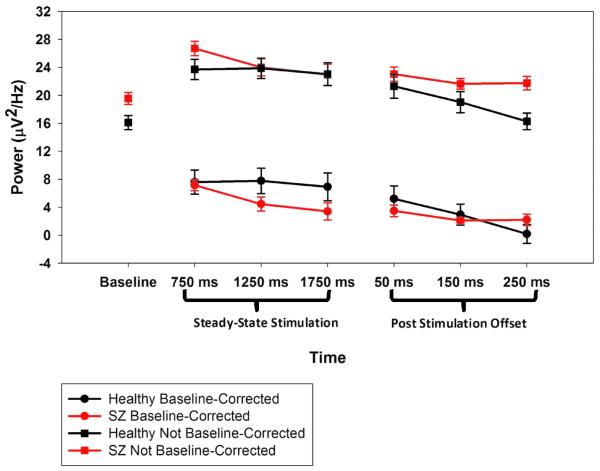
Figure 3.
Dynamics of non-baseline-corrected power at the driving frequency across time for healthy and SZ participants. Time labels on the X axis represent the baseline period (−324 to −50 ms pre-stimulus), centers of 500 ms windows during steady-state stimulation, and 100 ms windows for the period following steady-state stimulation offset.

