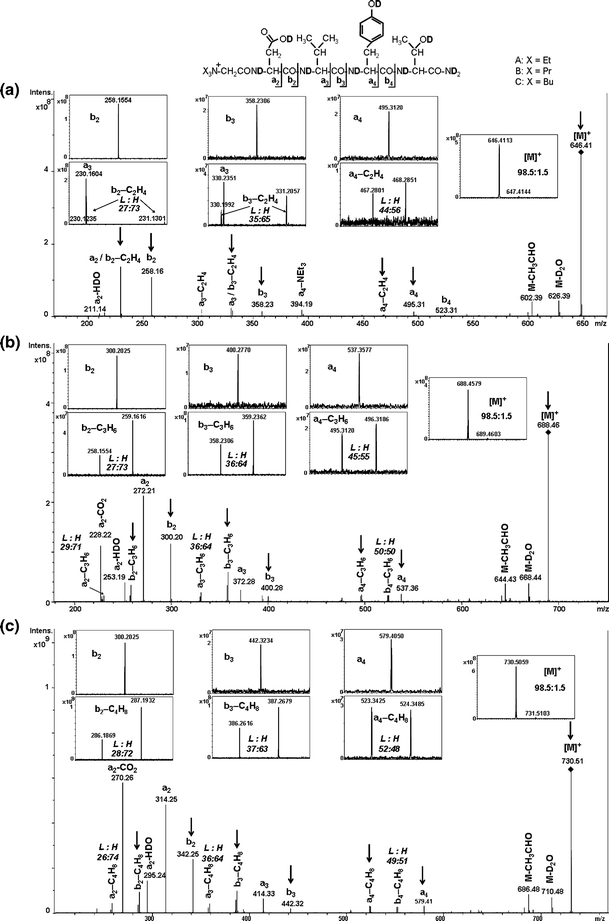
Figure 2.

ESI-MS/MS spectra of deuterated QAS-peptides. (a) d 9 -1b, X = Et, (b) d 9-1c, X = Pr, and (c) d 9 -1d, X = Bu. The peaks of representative fragments (L and H peaks) are shown in insets. ESI-MS/MS spectra for other deuterated QAS-peptides and ratios of L and H peak intensities for all QAS-peptides are presented in Supplementary Data (Figures 4–6S and Table 2S)
