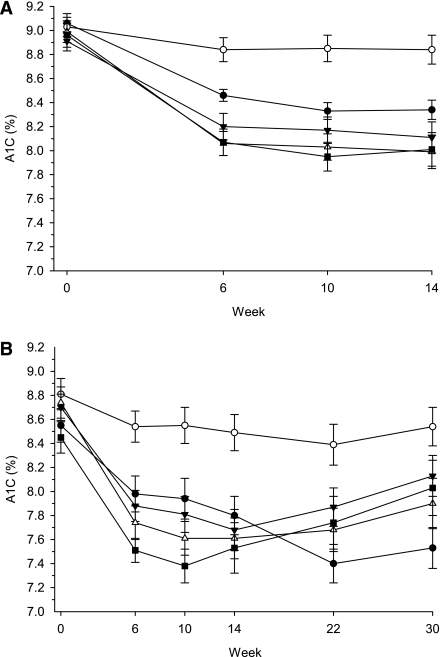
Figure 1.
A1C over time: (A) through Week 14 (primary efficacy time point) in the full analysis set and (B) through Week 30 in patients with results at Week 30 (n per group is 43 for placebo, 45 for 10 mg, 52 for 20 mg, 44 for 30 mg, and 41 for 40 mg). For both figures, ○ = placebo, • = MK-0941 10 mg t.i.d. a.c., ▼ = MK-0941 20 mg t.i.d. a.c., ▵ = MK-0941 30 mg t.i.d. a.c., ▪ = MK-0941 40 mg t.i.d. a.c. Data are expressed as mean ± SE.

