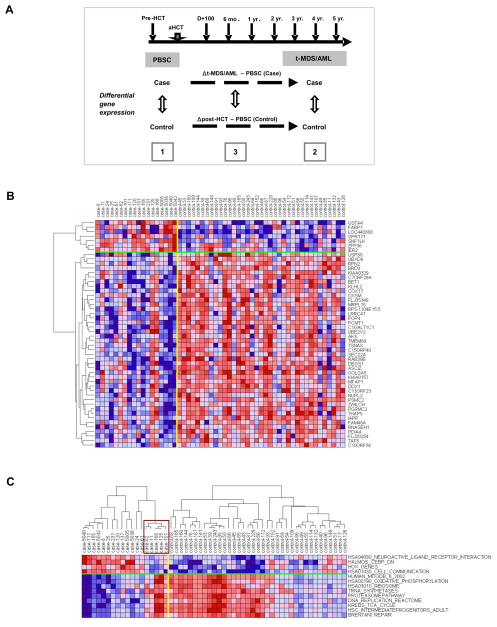
Figure 1. Altered gene expression in PBSC CD34+ cells from t-MDS/AML cases compared with controls.
(A) The study design is shown. Gene expression was compared between [1] pre-aHCT PBSC samples obtained from cases (n=18) versus controls (n=37); [2] BM samples obtained from cases at time of t-MDS/AML (n=12) versus BM samples obtained from controls at comparable time points post-aHCT (n=21); and [3] changes in gene expression over time from PBSC collection to development of t-MDS/AML in cases compared with gene expression changes over a comparable time period in controls (Δ t-MDS/AML – PBSC). (B) Differences in gene expression in PBSC CD34+ cells from cases and controls are shown for top 50 genes [with the smallest P-values and 4-fold change in OR (>4 or <0.25)]. (C) Expression of representative gene sets within individual PBSC CD34+ cells from individual cases and controls is shown. The expression was averaged over the genes in each gene set and hierarchical clustering was performed for samples within the case and control groups. The box indicates the five cases with gene expression resembling that of controls. See also Figure S1 and Tables S1, S2 and S4.

