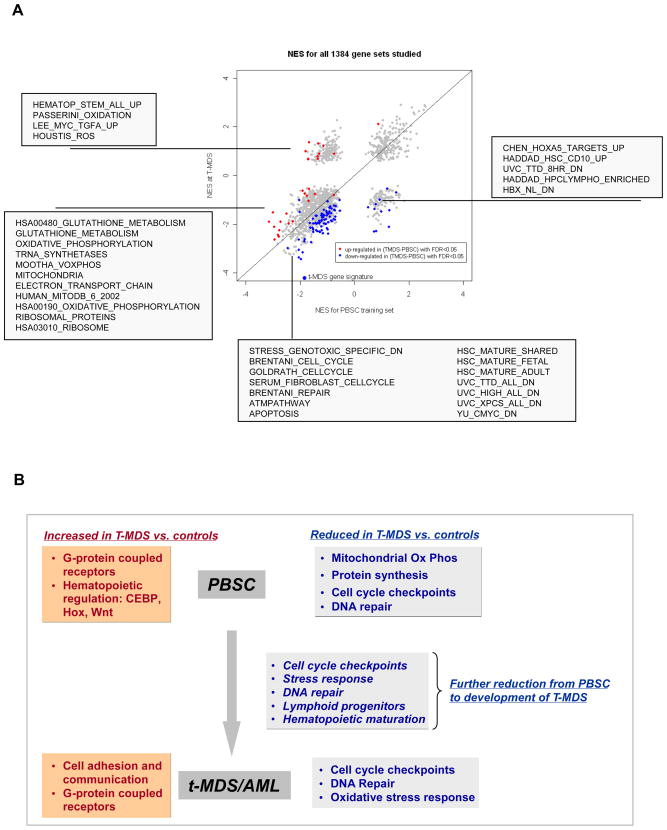
Figure 3. Changes in gene expression in CD34+ cells in the course of development of t-MDS/AML.
(A) Changes in gene expression from PBSC to development of t-MDS/AML. Normalized enrichment scores (NES) from GSEA analyses for altered gene sets in PBSC CD34+ and BM CD34+ cells at time of t-MDS/AML are plotted. Gene sets significantly upregulated (red) or downregulated (blue) in cases compared to controls from time of PBSC collection to time of t-MDS/AML with FDR <5% are highlighted and representative gene sets are listed in the boxes. (B) Gene expression signatures that are upregulated and downregulated in cases compared to controls in PBSC and at time of development of t-MDS/AML, as well as changes in gene expression from time of PBSC to development of t-MDS/AML are summarized. See also Table S7.

